


Navigate
Article List
- Gordon Cheung: Singapore Can Be a Focal Point in the Precious Metals Supply Chain
By The Assay magazine
- Shaping Customer Habits in Emerging Markets
By Jacek Baranowski, International Sales Manager, Metal Market Asia
- Changes Coming to Russia’s Gold Market
By Nikita Knyazev, Director, Precious Metals Market, Moscow Exchange
- Gold Forecast 2019 from a Technical Perspective
By Gary Wagner, The Gold Forecast, Wagner Financial Group
- Gold: Back in Favour
By Finews Asia
- A Need Creates a Golden Opportunity: Connecting Crypto to Gold
By Joshua Rotbart, Managing Partner, J. Rotbart & Co.
- SBMA News
By Albert Cheng, CEO, SBMA
Gold Forecast 2019 from a Technical Perspective
By Gary Wagner, The Gold Forecast, Wagner Financial Group
Published on March 28, 2019
Gary Wagner has been a technical market analyst for 35 years. He co-developed the first software application that identified candlestick patterns for market forecasting an is the co-author of Trading Applications of Japanese Candlestick Charting. He is the executive producer of TheGoldForecast.com, writes a daily column for Kitco News, and is a contributor to Technical Analysis of Stocks & Commodities magazine.
Cross of projections
This analysis elaborates our short-term model to forecast the gold price for H1 2019 which, if intertwined with our two long-term models (not covered here) projecting from 2001 and 1975 respectively, will see their paths intersect in December 2015 at a pivotal point at which gold prices would enter another bullish phase.
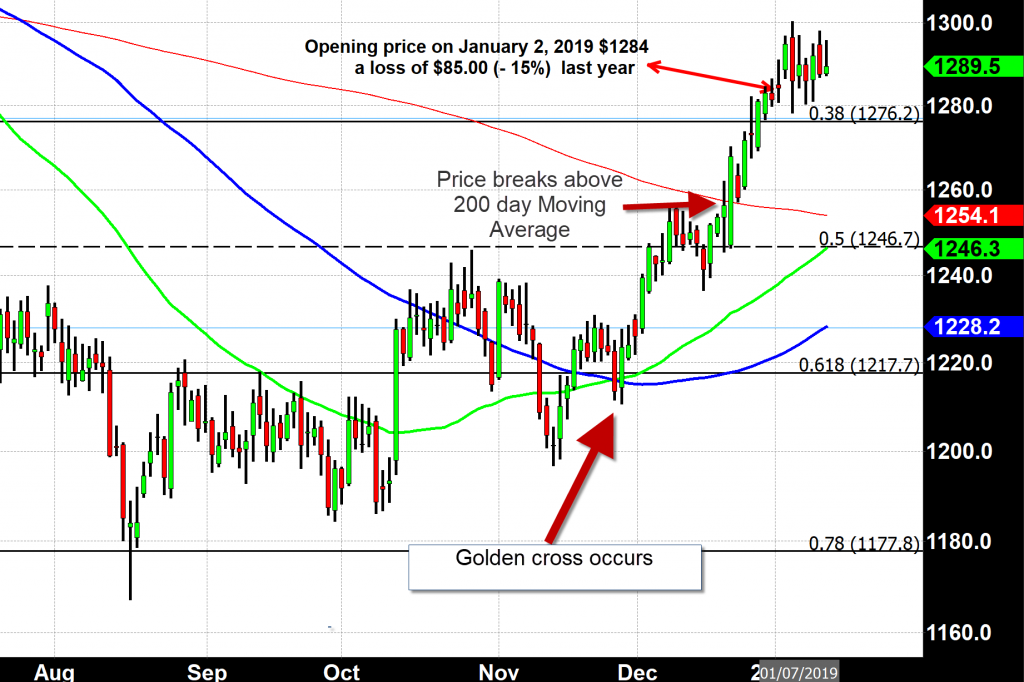
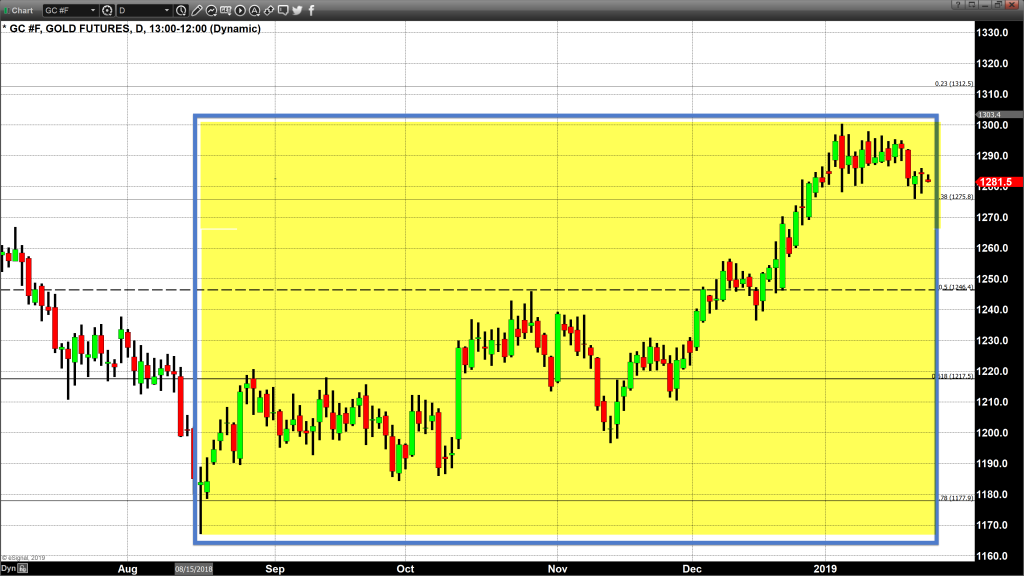
Figure A has the recent rally highlighted in yellow. It begins in mid-August 2018, and highlights the current market action up until January 23. This rally began at $1,168, the lowest in 2018.
This model indicates that a bullish rally is in play. A failure in breaching the technical resistance at $1,300 would lead to a correction that once it has run its course, could see gold trade as high as $1,352.
In November 2018, gold prices began to stage a highly energised surge through the 50-day and 100-day moving averages. Last week same month, a golden cross occurred when the 50-day moving average surpassed the 100-day moving average, adding more fuel to the uptrend. In late December, the price closed above the 200-day moving average for the first time since May 2018.
Closing above the 200-day moving average is a significant technical signal indicating a long-term bullish trend will come to formation. More so it will remain valid as long as the current price can hold above this average. Since January 2 gold has been consolidating and trading sideways.
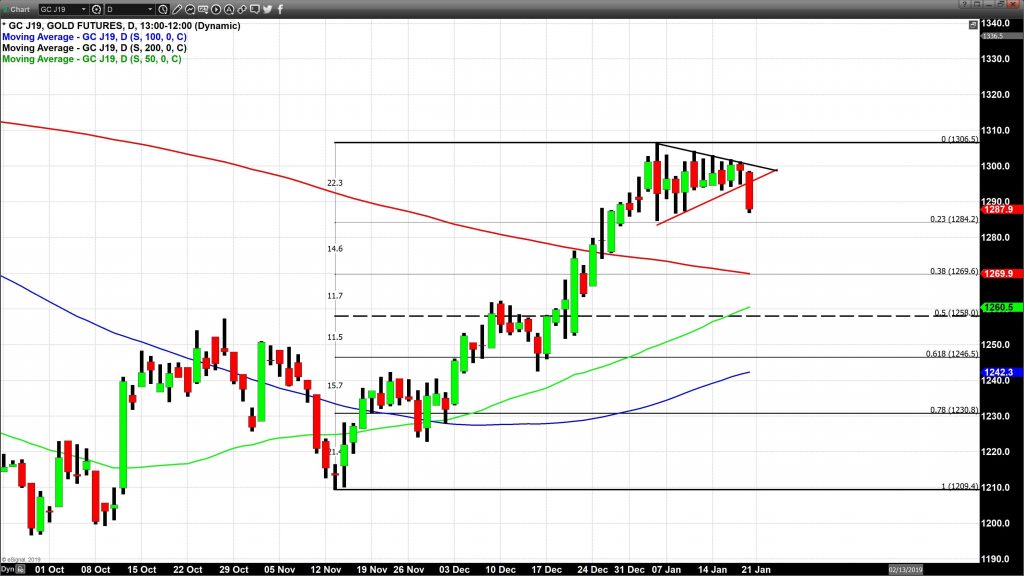
Figure C shows that the gold price broke below the symmetrical triangle. The corrective move could send gold down to $1,267 before veering back to $1,340 or further to $1,247 with a rally to $1,320 by the same measurement.
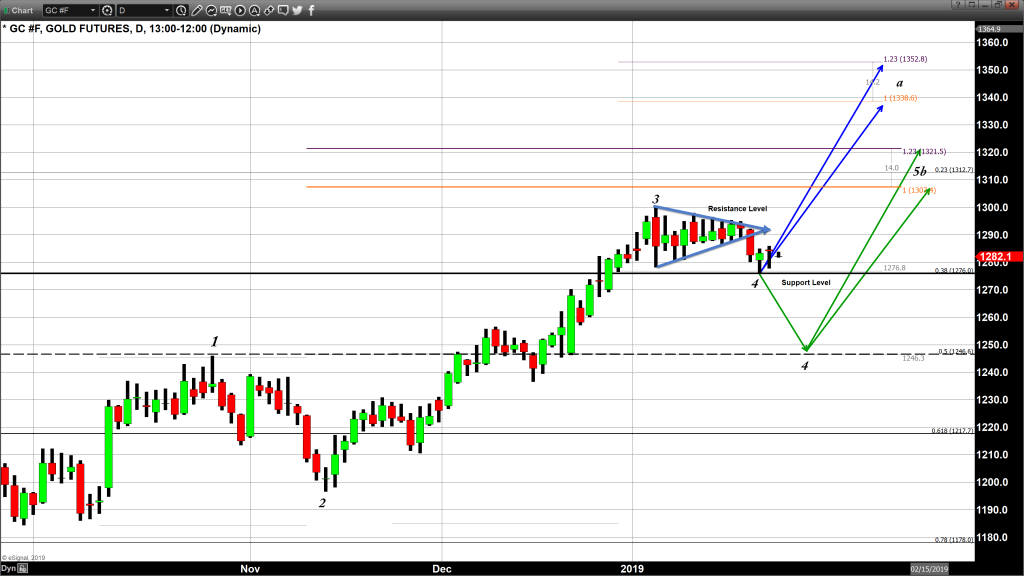
As Figure D shows, on January 4 gold traded in an expanded range as it hit a high of $1,300 before a sell-off to as low as $1,278. The following week saw a series of dwindling lower-high and higher-low swings, which developed into a converging triangle pattern. Gold eventually broke below the support line on January 18.
Figure D also demonstrates a model based upon the resistance level at $1,300 and the start of a correction. If the correction concludes at the 0.38% retracement ($1,276), the next rally could take gold as high as $1,336–1,352. If the fourth wave ends at the 0.5% retracement ($1,246), gold is likely to rally to $1,312 –1,321.
Long-term cycle
Our research suggests that gold is in the final phase of a major long-term impulse cycle. This model also provides a look-back at the final major bullish wave could be traced back to end of 2015, following a correction to $1,040. This corrective fourth wave developed from the all-time high at $1,900 in 2011. The model suggest that gold could re-test the record highs that, if taken out, could see an extensive surge to between $1800 and $2200 per troy ounce.
The super-long bullish run from 2001 to 2020 has five major waves. The fifth wave started at $1,040, in December 2015. Red and blue lines in Figure E represent the two Fibonacci extensions.
There are two accepted techniques to forecast the fifth wave. The first technique is to use wave one and use the price gained to create the fifth wave. This will result in wave 1 and wave 5 being equal in length. The other technique is to use a Fibonacci extension of wave three. Since wave three cannot be the shortest of any impulse wave, theoretically the extension could be up to a 1 to 1. However, most Elliott wave technicians will use a .618%, or a .78% extension of wave three to forecast wave five.
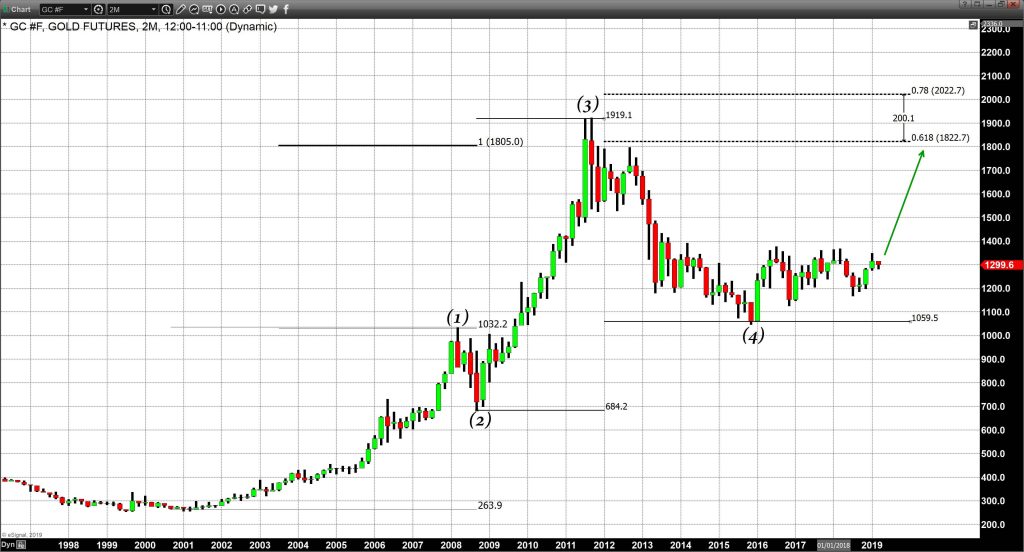
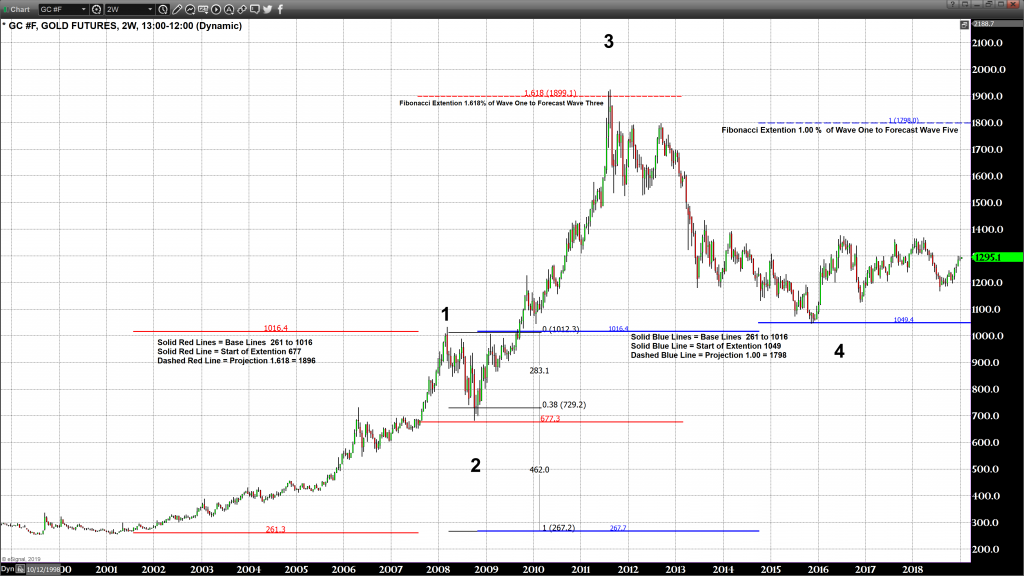
Figure F contains a Fibonacci extension of wave three to forecast the final fifth wave on the right-hand side of the chart. This extension of wave three is charted at both the .618% and .78% extension of wave three. and a 1-for-1 extension of wave one on the right. The lowest projection is that gold will reach a high of $1,805, and the highest projection looks for gold to trade to $2,022 (.78% extension) by 2022.
Charts used in this article are made using data from the e-Signal platform by Interactive Data.
Gary Wagner has been a technical market analyst for 35 years. He co-developed the first software application that identified candlestick patterns for market forecasting an is the co-author of Trading Applications of Japanese Candlestick Charting. He is the executive producer of TheGoldForecast.com, writes a daily column for Kitco News, and is a contributor to Technical Analysis of Stocks & Commodities magazine.